The “Zero-Click = Zero-Value” Fallacy
There's an argument I've been hearing more and more from executives and finance teams which goes something like, “AI Search is killing our traffic, so let's cut SEO spend.” The reasoning sounds rational if the only thing you're looking at is GA4 organic sessions trending flat or downward while AI Overviews eat the top of the SERP. But the conclusion is wrong, and the reasoning reveals a misunderstanding of what SEO has always been measuring vs what it was always supposed to measure.
The click was always a proxy. It was a convenient one because it was easy to count, easy to chart and easy to tie to downstream conversions in a last-click GA4 report. Now the proxy is partially broken. Users are getting answers directly in AI Overviews, Perplexity, ChatGPT Search and Gemini without ever visiting the source. The click is missing but the influence is still happening. Someone asked an LLM for a recommendation, your brand was in the answer, they formed a mental association, and two days later they searched for your brand name directly or typed your URL in. GA4 calls that “Direct” traffic and hands the credit to no one.
The honest truth is that the old way of measuring SEO was never particularly accurate to begin with. It just felt accurate because the numbers lined up in a nice report. Now the numbers don't line up anymore and people are panicking. The real question isn't “did they click”, it's “did our content influence the decision”. The rest of this article is five concrete attribution models for answering that question, along with the data required to run each one, the math where math is helpful, and the tradeoffs. Pick what fits your situation. You don't need all five. This piece is specifically about measurement, not AI search optimization itself, but you can't optimize what you can't measure so start here. For the upstream context on why GA4 is blind to most of this in the first place, see AI Search Broke the Funnel.
What Are We Actually Trying To Measure?
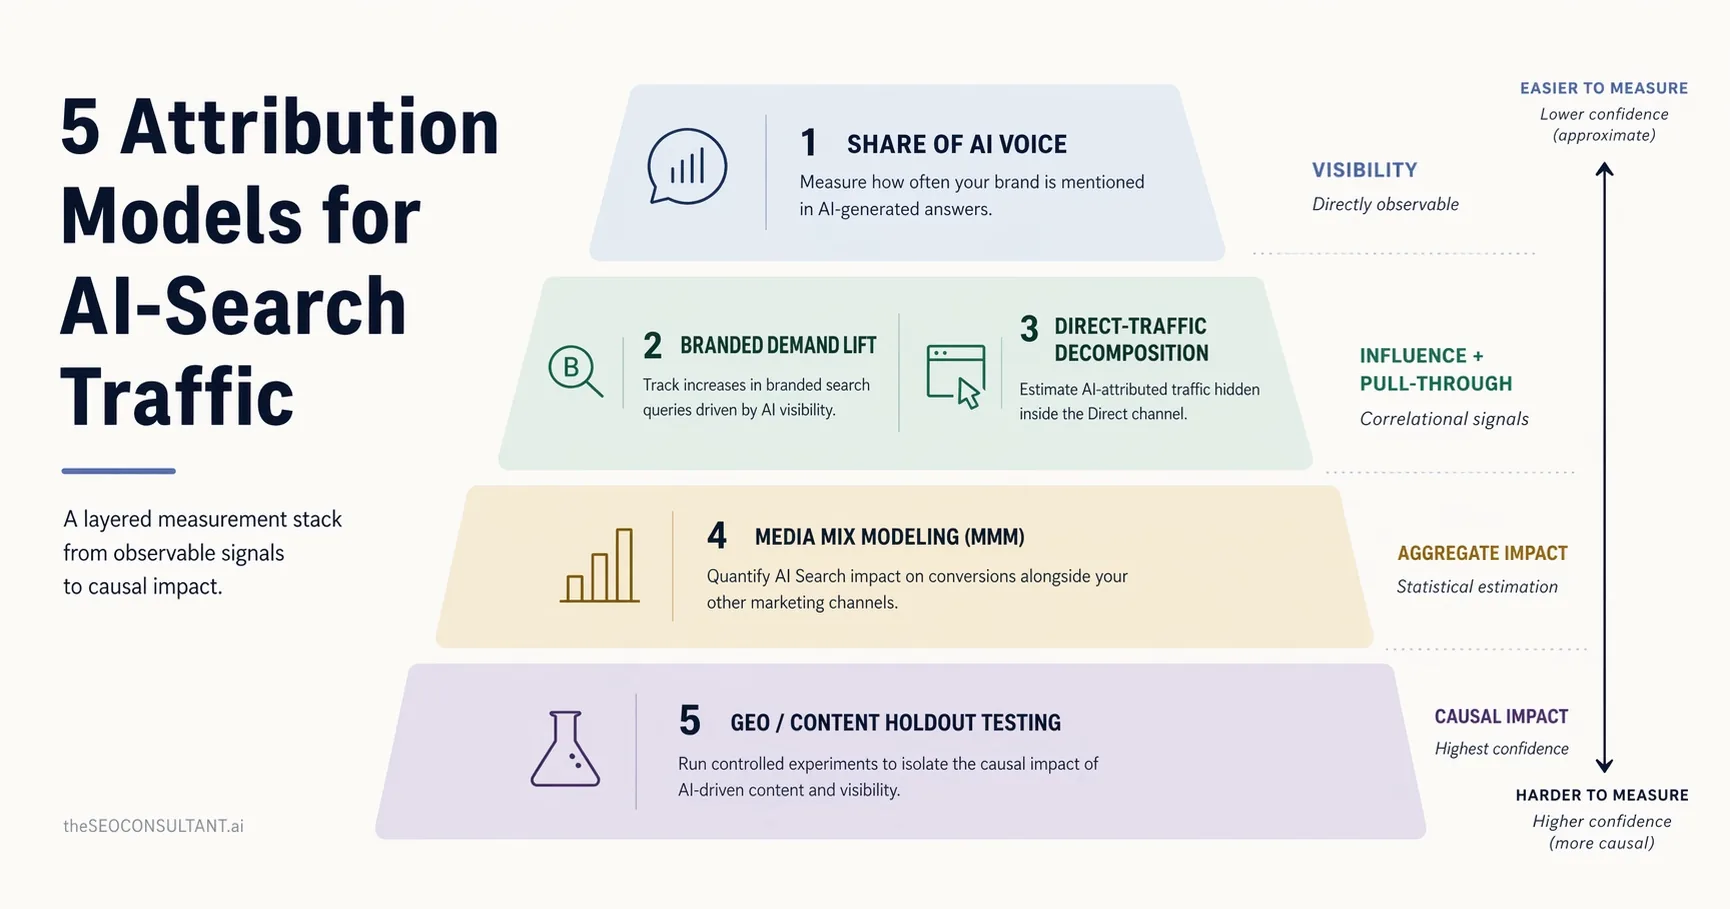
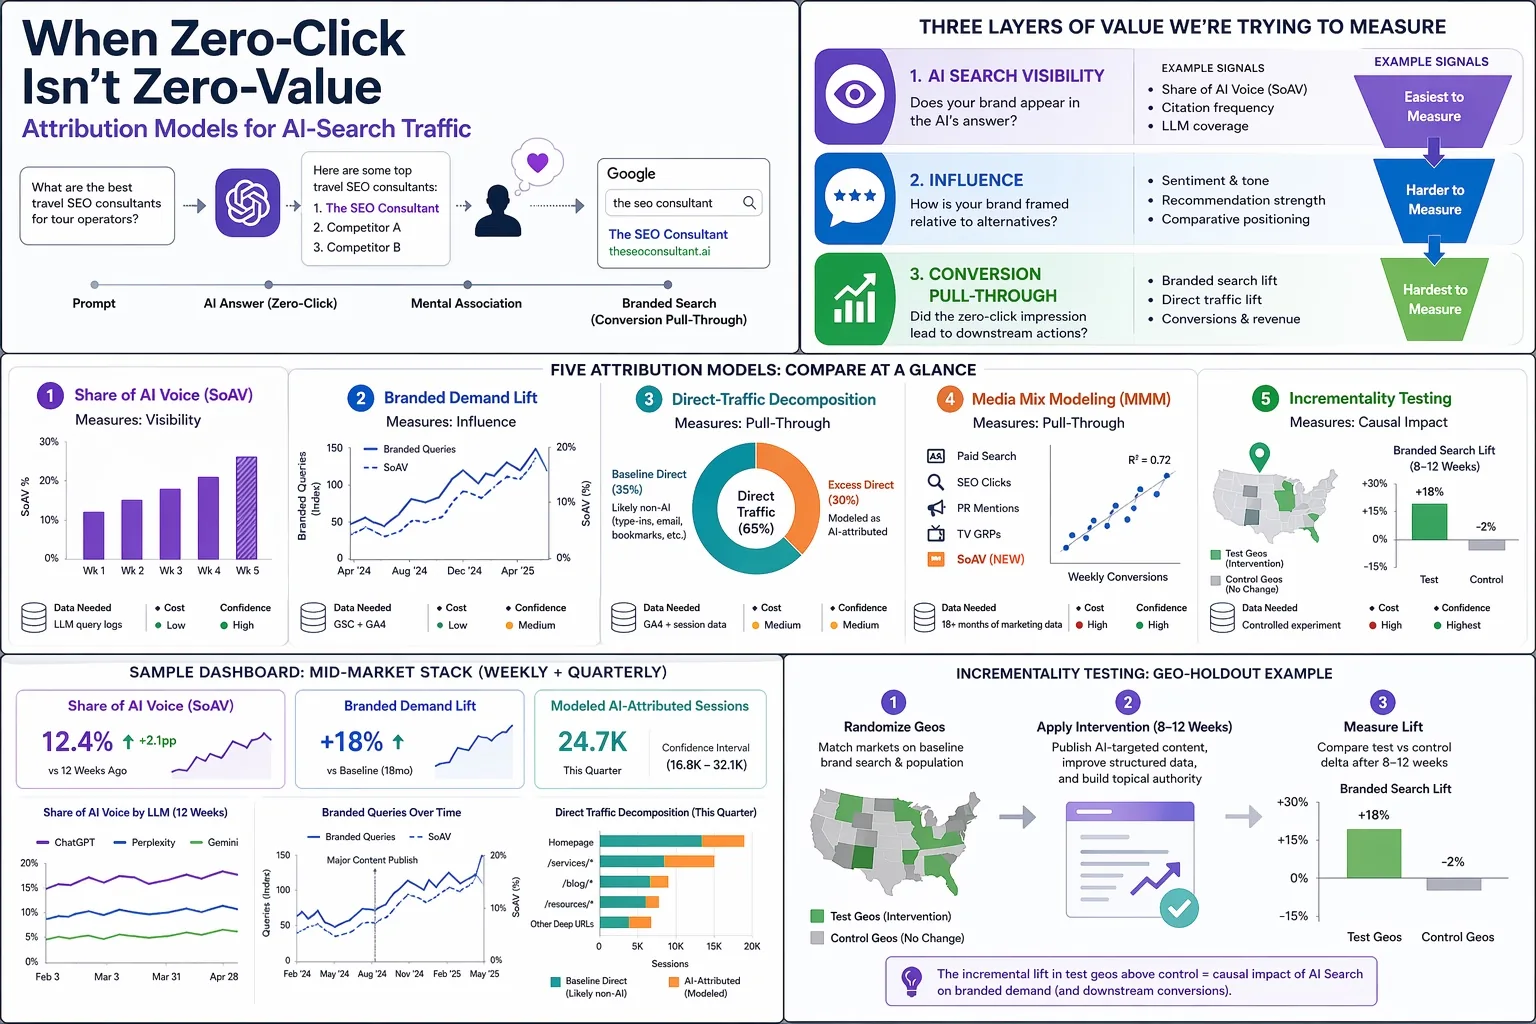
When someone says “measure AI Search”, they usually conflate three different layers of value. Separating them is the first honest step toward measuring any of them.
AI search visibility is the surface-level question of whether your brand shows up in the AI's answer at all. If I ask ChatGPT “what are the best travel SEO consultants for luxury tour operators” and my brand appears in the response, I have AI search visibility. If it doesn't, I don't. This is the easiest layer to measure because you can actually observe it. Query the LLMs, log what they say, and count.
Influence is the question of what the AI said about you and how your brand was framed relative to alternatives. Visibility alone is insufficient because mentions can be neutral, favorable, dismissive or factually wrong. I wrote previously about how ChatGPT kept confusing my brand with a film producer from Hong Kong named Raymond Wong. Being mentioned is not the same as being correctly represented. Influence is the layer where sentiment, framing and recommendation strength live.
Conversion pull-through is the downstream action that a zero-click impression seeded. Branded search a week later. A direct URL type-in. A demo request where the buyer already knows your name before they even land. This is the hardest layer to measure because it's temporally separated from the AI interaction and none of the usual session-stitching tools work anymore.
Every model in this article targets at least one of these layers. Some target more than one. The point is that when someone says “we can't measure AI Search” what they usually mean is “we can't measure it the way we used to measure search.” Which is true, but also beside the point.
What Are The Attribution Options?
Here is the set I'll walk through, mapped against cost, complexity and which layer each one actually measures. The short version is that the cheap models are correlational and the expensive ones are causal. You generally want the cheap ones running continuously and the expensive ones running occasionally to calibrate the cheap ones.
| Model | Layer Measured | Data Needed | Cost | Confidence |
|---|---|---|---|---|
| Citation-share tracking | Visibility | LLM query logs | Low | High for what it measures |
| Branded demand lift | Influence | GSC + GA4 | Low | Medium (correlational) |
| Direct-traffic decomposition | Pull-through | GA4 + session data | Medium | Medium |
| Media Mix Modeling | Pull-through | 18+ months of marketing data | High | High if data is clean |
| Geo/content holdout testing | Causal | Controlled experiment | High | Highest |
The rest of the article is one section per model. Skip to whichever one fits the problem you're actually trying to solve.
What Is Share Of AI Voice?
Share of AI Voice, or SoAV, is the cleanest place to start because it directly observes what's happening. The idea is simple. Build a list of prompts a potential customer might actually ask an LLM in your category. Query those prompts regularly across ChatGPT, Perplexity, Gemini and whatever else matters in your market. Count how often your brand is mentioned relative to total mentions of any brand in that category.
SoAV measurement is also moot if your site is blocked to AI crawlers in the first place. Before you build a measurement pipeline, check your robots.txt for GPTBot, ClaudeBot, PerplexityBot and Google-Extended directives and make sure you're actually accessible to the bots you're trying to measure citations from. I still see sites where the SEO team is frustrated about low AI Search visibility while the infrastructure team has been quietly blocking every AI crawler in robots.txt for months.
The formula is straightforward:
SoAV = Σ(brand_mentions_p × weight_p) / Σ(total_category_mentions_p × weight_p)Where p iterates over your prompt basket and weight is usually something like search-volume-normalized importance. A brand mentioned 12 times across a 100-prompt basket, against a category total of 87 mentions across the same 100 responses, has a SoAV of roughly 14%.
A simple Python implementation looks like this:
from openai import OpenAI

client = OpenAI()

def get_brand_mentions(prompt, brand_list):
    """Query ChatGPT and count mentions of each brand in the response."""
    response = client.chat.completions.create(
        model="gpt-4o",
        messages=[{"role": "user", "content": prompt}]
    )
    text = response.choices[0].message.content.lower()
    return {brand: text.count(brand.lower()) for brand in brand_list}

def calculate_soav(prompt_basket, brand_list, target_brand):
    total_target = 0
    total_category = 0
    for prompt, weight in prompt_basket.items():
        mentions = get_brand_mentions(prompt, brand_list)
        total_target += mentions[target_brand] * weight
        total_category += sum(mentions.values()) * weight
    return total_target / total_category if total_category > 0 else 0

# Example: prompt basket weighted by approximate search demand
prompts = {
    "Best travel SEO consultant for tour operators": 1.0,
    "Who is the top B2B SEO consultant in the US": 0.8,
    "SEO consultants that specialize in marketplace sites": 0.6,
}

brands = ["The SEO Consultant", "Competitor A", "Competitor B"]
soav = calculate_soav(prompts, brands, "The SEO Consultant")
print(f"Share of AI Voice: {soav:.1%}")
This is a deliberately simple implementation. str.count() will match substrings (“Apple” inside “pineapple”) and counts frequency rather than presence, so for production use swap it for a word-boundary regex like re.findall(r"\b" + re.escape(brand) + r"\b", text) and decide whether you're measuring mentions or distinct responses that mention the brand.
I already wrote about the infrastructure for running this kind of monitoring in my post on Brand Monitoring on LLM AI Search. The setup there uses the OpenAI API and Google's Natural Language API for entity extraction, stores responses in BigQuery and visualizes the trends in Looker Studio. If you want the longer version of how to stand up this pipeline, start there.
Strengths: Directly observable. You can chart SoAV week over week and watch it respond to your content efforts. It is also defensible in an executive conversation because you're reporting on something real that happened in a real LLM, not a derived statistical construct.
Weaknesses: SoAV alone doesn't tie to revenue. A brand with 40% SoAV in a niche with zero downstream purchase intent is still generating very little pipeline. SoAV works best when paired with one of the pull-through models below.
Practical tip: Don't over-prompt. LLM responses can vary even across anonymized sessions so you'll get some noise no matter what you do, but there are diminishing returns to prompting 50 times per day when 1 to 3 times per day on a well-constructed basket is enough for trend analysis. There's also a real monetary and environmental cost to running excessive prompts and it adds up fast if you're monitoring dozens of competitors.
How Do You Measure Branded Demand Lift?
The premise behind branded demand lift as an attribution model is straightforward. If LLMs are mentioning your brand in their answers, then over time you should see increases in branded search queries and direct traffic downstream. A user reads the AI response today, they remember the brand name a few days later, they type your name into Google or your URL into a browser. That behavior leaves a trail in Google Search Console and GA4 even when the initial AI interaction doesn't.
The method is to segment your Google Search Console queries into branded and non-branded buckets, then regress the branded query volume against either your SoAV from Model 1 or against your content publish cadence. A rough specification looks like:
ΔBranded_queries = β₀ + β₁·SoAV + β₂·seasonality + β₃·paid_brand_spend + εThe key variable is β₁, which tells you how much branded query volume moves per unit increase in SoAV (expressed as a decimal, so β₁ × 0.10 is the expected lift from a 10-point SoAV increase) after controlling for seasonality and any brand-level paid media that might also be driving branded search. If β₁ is positive and statistically significant you have directional evidence that AI Search is seeding branded demand.
Strengths: Uses data you already have. Google Search Console is free and GA4 is already running. There's no new pipeline to build beyond a regression notebook and a quarterly cadence. Branded demand lift is also a reasonable proxy for brand awareness and brand equity as they relate to AI Search, which is what most executives are really asking about when they ask whether AI Search is “working” for the business.
Weaknesses: This is correlational, not causal. A PR campaign, a podcast mention, or a paid brand awareness flight can all move branded search at the same time your SoAV moves and the regression will struggle to separate them if you don't have clean data on those other inputs. For mid-market clients who aren't running heavy brand PR, the signal is usually cleaner. For enterprise clients with many overlapping brand activities, Model 4 (MMM) usually beats this one.
Practical tip: Look at net-new branded query strings that appear month over month rather than total branded volume. If you start seeing long-tail branded queries like “[brand name] vs [competitor]” or “is [brand name] legit” or “[brand name] pricing” showing up for the first time, that's usually an indicator of AI-seeded research intent. Total branded volume can be polluted by existing brand equity. Net-new branded strings are a cleaner signal of fresh awareness. Search Query Data Mining covers how to structure the query segmentation pipeline.
Can You Decompose Your Direct Traffic?
The direct vs organic traffic split in GA4 has shifted meaningfully since AI Overviews rolled out, and that shift is the starting point for this model. This is the most speculative of the five, so I'll spend more time on it and be explicit about where the assumptions get shaky. Most GA4 implementations I look at these days have roughly 50 to 70% of their total sessions classified as “Direct” in the default channel grouping. Pre-SGE (so before mid-2023) that number was typically closer to 25 to 40%. To be clear, this is a directional observation from the accounts I've personally looked at, not a rigorously sampled industry statistic, and it is a different measurement from the Loamly figure (which reported roughly 70% of AI-referred traffic specifically landing in Direct, not Direct as a share of all sessions). The two numbers get conflated easily so it's worth keeping them separate. Something changed and the usual explanations (tracking blockers, browser privacy updates, iOS 14) don't fully account for the magnitude of the shift. A reasonable hypothesis is that a meaningful chunk of the excess Direct is AI Search referral stripping where users clicked through from an LLM interface that didn't pass a referrer, or went to the site later after reading the AI response.
The method is to decompose the Direct channel into baseline Direct (which was always there) and excess Direct (which is plausibly AI-attributed). Here's how I'd approach it step by step:
Step 1: Set a pre-AI baseline. Pull GA4 or Universal Analytics data from 2022 or early 2023 before Google's SGE went experimental and well before AI Overviews hit general availability in May 2024. Calculate Direct as a percentage of total sessions for that period. That's your baseline ratio. For most content sites I've looked at it's in the 25 to 40% range.
Step 2: Measure current excess. Calculate the same ratio for the current period. Subtract baseline from current. That difference, multiplied by current total sessions, is your excess Direct volume.
Step 3: Fingerprint the excess. This is where it gets interesting. Not all Direct traffic is created equal. Use these signals to separate AI-attributable Direct from genuine type-ins:
- Landing page URL depth. True brand recall goes to your homepage. Deep URLs like
/services/travel-seo-consultantor/blog/topic-clustering-for-content-marketingbeing hit as Direct is highly suspicious. No one types/blog/topic-clustering-for-content-marketingfrom memory. That's referrer-stripped traffic from somewhere, and “somewhere” increasingly means AI Search. - Geography and device distribution. If your excess Direct disproportionately comes from desktop in English-speaking markets, it aligns with current LLM user demographics. If it's a geographic profile matching your email list, it's more likely newsletter click-throughs where UTMs got lost.
- Time-of-day pattern. LLM usage skews to weekday business hours in a way that genuine brand recall does not.
- Time-to-conversion. Direct sessions that convert on first visit are often brand loyalists. Direct sessions that convert after 2 to 5 subsequent visits with researched URL paths look like AI-seeded discovery.
Step 4: Model the attribution. Build a simple rules-based or regression model that classifies each Direct session with a probability that it came from AI Search. The deep-URL-first-touch Direct sessions get a high probability. The homepage-first-touch Direct sessions get a low probability. Sum the probabilities across the period to get your modeled AI-attributed sessions.
Strengths: You're recovering signal that is already sitting in your GA4 account. No new tooling. No new APIs. No new spend. Just SQL and a weekend.
Weaknesses: The baseline assumption is that pre-AI Direct was “normal” and excess Direct is AI-driven, but iOS 14 and general tracking decay muddle that. You have to be honest about confidence intervals. The model gives you a plausible range, not a point estimate. An executive who wants one number is going to push back.
Practical tip: Do this exercise quarterly, not weekly. It's a board-reporting model, not a tactical optimization model. If you run it monthly you'll just see noise. Quarterly gives you a trend that is directionally useful.
How Does Media Mix Modeling Apply To AI Search?
I've written before about whether Media Mix Modeling can be used for measuring SEO value. The short answer was yes but with significant caveats about data requirements and statistical literacy. The longer answer is that MMM is actually one of the better-suited techniques for measuring AI Search specifically because it doesn't need user-level data. It works at the aggregate weekly level. That turns out to be exactly the right level when user-level data is the thing that's disappearing.
The adaptation is simple. Add SoAV from Model 1 as a new weekly regressor in your existing MMM alongside paid spend, SEO clicks, PR mentions, TV GRPs and whatever else you're already tracking. A typical MMM spec looks something like:
Weekly_conversions = intercept
                   + adstock(paid_search_spend)
                   + adstock(paid_social_spend)
                   + seo_clicks
                   + soav_weighted          # NEW
                   + branded_pr_mentions
                   + seasonality_controls
                   + ε
The coefficient on soav_weighted is your estimated conversion impact per unit of AI visibility, holding everything else constant. With 18 to 24 months of clean weekly data and a stats-literate analyst you can get a defensible answer here.
Strengths: Aggregate-level, which sidesteps the user-level data collapse entirely. Works across channels so it naturally contextualizes AI Search against your other marketing. Gives you something defensible for a CFO conversation.
Weaknesses: MMM requires 18 months of history minimum and ideally more. If you just started tracking SoAV six months ago, you don't have enough data yet. It also requires someone who knows what they're doing statistically. I've seen plenty of “MMM” decks that were actually just correlation charts with a linear regression on top, and those tend to mislead more than they inform.
When to recommend MMM: Enterprise clients with diverse channels, mature tracking and a dedicated analytics team. For sub-$1M revenue sites or solo businesses it's overkill. The time and budget to build an MMM properly is better spent on Models 1 through 3 plus an occasional Model 5 calibration test.
What Is An Incrementality Test For AI Search?
The first four models are all approximations. Good approximations, but approximations. If you want to know for certain whether AI Search is driving value, you have to run a controlled experiment. That's what incrementality testing does and it's the closest thing to a gold standard that currently exists for this kind of measurement.
There are two practical flavors.
Geo-holdout testing. Pick a set of geographic markets where your brand has comparable baseline visibility. Randomize them into test and control groups. In the test geos, publish or optimize a set of AI-targeted content pieces and push hard on the inputs that drive AI Search (structured data, topical authority, entity coverage). In the control geos, do nothing different. After 8 to 12 weeks, measure the delta in branded search volume, direct traffic, and (if you have the measurement) downstream conversions. The incremental lift in the test geos above control is your causal AI-attributed impact.
Content-holdout testing. Pick a representative sample of pages on your site and block AI crawlers from them using robots.txt directives for GPTBot, ClaudeBot, PerplexityBot and Google-Extended. Leave the rest of the site accessible. Over the following 8 to 12 weeks, compare the citation rates (Model 1) and downstream branded search impact of the blocked pages vs the accessible ones. If the accessible pages drive materially more brand lift than the blocked pages, AI Search is doing real work.
Strengths: This is causal inference, not correlation. If the test is designed well the result is defensible against any skeptical CFO.
Weaknesses: Slow. You can't run this in two weeks. Eight to twelve weeks is the realistic floor and longer is better. Some clients won't sacrifice pages or geos for a test, especially if they think they're losing ground competitively. You also need enough baseline volume for the delta to be statistically meaningful, which rules out very small sites.
Practical tip: Start with a 2-geo pilot before selling a client on a full multi-geo program. Two geos is enough to prove the methodology works and gives you a realistic cost estimate for the full program. Don't propose a 20-market incrementality test as the opening move.
Which Attribution Models Should You Use Together?
Nobody needs all five. The question is which combination fits your client's size, data maturity and reporting needs. Here's my default stack for mid-market clients who want something that actually works without the enterprise price tag:
Weekly (continuous): Model 1 (SoAV) + Model 2 (branded demand lift). These are your tactical dashboards. SoAV tells you whether your AI visibility is going up, flat or down. Branded demand lift tells you whether that visibility is translating into measurable downstream demand. Both use cheap data and both respond quickly enough to see the impact of content efforts within weeks.
Quarterly (for board reporting): Model 3 (direct-traffic decomposition). This is the one to put in front of executives because it produces a modeled revenue or session number that answers the “so what” question. A CFO wants a single line that says “AI Search drove an estimated X% of pipeline this quarter” and Model 3 gives you something defensible at that level.
Annually (for calibration): Model 5 (one well-run incrementality test). Use this to check whether Models 1 through 3 are over or under-counting. If SoAV says AI Search should be driving 8% lift and a geo-holdout measures 3%, you know your cheap models are optimistic and you need to discount them. This annual calibration is what keeps the other models honest.
Skip MMM (Model 4) unless the client already runs one. Building an MMM from scratch to measure one channel is not a good investment. If the client has an MMM already, great, add SoAV as a regressor. If they don't, don't sell them one for this purpose alone.
A sample dashboard for the mid-market stack has three headline numbers at the top: Share of AI Voice (current week and 12-week trend), Branded Demand Lift (percentage change vs baseline), and Modeled AI-Attributed Sessions (quarterly estimate with confidence interval). Below that sit supporting charts for SoAV by LLM (ChatGPT vs Gemini vs Perplexity), branded query volume with publish overlays, and Direct traffic decomposition by landing page depth. Looker Studio handles this cleanly without custom dev work if the underlying data is in BigQuery.
How Do You Report Zero-Click Value To Executives?
The hardest part of this entire exercise is not the measurement. It's the conversation with an executive who has been trained for 15 years to expect clean last-click attribution and is now being told the numbers are modeled approximations. There are a few ways to make that conversation go better.
Lead with the three-number summary. Every quarterly readout should open with Share of AI Voice, Branded Demand Lift and Modeled AI-Attributed Revenue. Three numbers. Not 30. Not a wall of charts. Three. The executive wants to know whether AI Search is a positive or negative input to the business and those three numbers answer it.
Be honest about the modeling. If your Modeled AI-Attributed Revenue has a confidence interval of plus or minus 30%, say so. Executives can handle honest uncertainty. They can't handle a number that turns out to be wrong after they budgeted against it.
Have a script for the “but GA4 shows organic is flat” pushback. The answer is something close to: “GA4 is undercounting AI Search because the referrer is stripped. The flat line is the measurement, not the reality. Here's what the reality looks like when we triangulate across three independent methods.” Then show Models 1, 2 and 3 moving in the same direction. Convergent evidence is more persuasive than any single chart.
Don't promise precision you can't deliver. The old last-click world had the illusion of precision. It wasn't actually precise, but it looked like it was. The new world has approximations that are more honest about their uncertainty. That's an upgrade in accuracy even if it feels like a downgrade in precision. Be direct about the tradeoff instead of pretending you can give an executive a 2-decimal-place number for AI Search revenue attribution. No one can give that yet. Anyone saying they can is selling something.
The old last-click world had the illusion of precision. It wasn't actually precise, but it looked like it was. The new world has approximations that are more honest about their uncertainty.
Limitations And Honest Caveats
I want to be upfront that every model in this article is an approximation. The ground truth (individual users, individual AI interactions, individual downstream conversions stitched together) is gone and it isn't coming back. What we have is a set of techniques for triangulating value from aggregate signals. Triangulation works pretty well. It just isn't the same thing as direct observation.
A few honest caveats to keep in mind:
Triangulate, don't single-source. No single model is trustworthy on its own. The point of running three or four in parallel is that when they agree you have directional confidence, and when they disagree you have a signal to investigate. A SoAV that's trending up while branded demand is trending down is telling you something. Either the mentions are negative-sentiment or they're for prompts that have no purchase intent or the downstream measurement is broken. Pick one and check.
Re-baseline annually. AI Search user behavior is shifting faster than traditional search behavior did. A baseline you set in Q1 2025 is probably stale by Q1 2026. Build baseline refreshes into your measurement cadence rather than treating baselines as permanent.
Watch for LLM-specific gaming. People are already trying to manipulate AI Search citations the same way they manipulated backlinks in 2010. At some point the platforms will push back on the obvious stuff and your SoAV measurements will suddenly shift for reasons that have nothing to do with anything you did. Don't panic. Just note the event and re-baseline.
Model 3 is the most speculative of the five. I still think it's the most original contribution here, but the baseline-subtraction approach relies on assumptions about pre-AI traffic that get shakier the further you get from 2022. If you only run one of these models, start with Model 1 and Model 2, not Model 3.
What Should You Actually Do Next?
The practical next step depends on where you are right now. If you have zero AI Search measurement in place, start with Model 1. Build a prompt basket of 20 to 50 prompts that matter for your category, query them weekly across the major LLMs, store the responses, count the mentions. You can stand this up in a weekend with the Python approach I outlined in the brand monitoring article.
If you already have Model 1 running, add Model 2 next. Segment your Google Search Console data into branded and non-branded queries, pull 18 months of history if you have it, and start tracking branded volume against your SoAV trend. A simple regression in a Colab notebook is enough for the first pass.
If you're an enterprise with a mature MMM, talk to your analytics team about adding SoAV as a regressor. That's the single highest-leverage thing a large company can do for AI Search measurement right now and most of them haven't done it yet.
And if you're at the point where you need causal evidence for a skeptical leadership team, plan a 2-geo incrementality pilot. Pick markets, pick the content lever, commit to 12 weeks, then measure. The pilot itself becomes the business case for a larger program.