Why I Built It
AI Search retrieval is brutal on bad markup. When Gemini, ChatGPT, or Perplexity reach for a passage to cite, they're walking the DOM the same way assistive tech does — looking for landmarks, headings, and proper interactive elements. A page built out of <div onclick> soup with five H1s and no <main> can rank fine on classic Google but vanish from AI Overviews because nothing in the structure tells the model what's actually content.
I needed a tool that could grade a page on those signals at a glance. Lighthouse audits some of this, but it doesn't connect the dots — semantic HTML, schema coverage, meta tags, alt text, heading hierarchy — into a single AI-Search-readiness verdict. So I built one.
The other goal: make the suggestions actually trustworthy. LLMs love to invent plausible-sounding HTML rules. To prevent that, the analyzer is grounded in a documented rule set derived from web.dev, W3Schools, and other trusted sources — with explicit decisions recorded for the cases where sources disagree.
What It Catches
A handful of the most common violations on real pages — the ones that show up in nearly every audit.
- Div soup with click handlers. A
<div onclick="…">looks like a button visually but isn't keyboard-focusable, screen readers ignore it, and the browser doesn't fire activation on Enter or Space. Use<button>for actions;<a href>for navigation. - Skipped heading levels. An
<h2>followed by an<h4>with no<h3>in between breaks the document outline. Most retrieval systems and assistive tech walk the heading tree to understand section hierarchy. - Multiple H1s — or zero. Browsers and screen readers don't implement the HTML5 document-outline algorithm in practice; they treat the first H1 as the page title. Multiple H1s muddy the signal. Zero is broken.
- Spans styled as headings. A
<span class="section-heading">Work</span>looks like an H4 visually, but it doesn't appear in the heading tree. Crawlers and AI scrapers miss the section structure entirely. - Missing image alt attributes. Decorative images take
alt=""(empty but present). Missing entirely is broken.alt="image"oralt="photo"is worse than empty — describe what the image actually conveys. - No
<meta name="viewport">. Google's index is mobile-first; a missing viewport tag is one of the strongest negative signals you can ship. - JSON-LD that drifts from the visible page. Schema entity names that don't match what's rendered can be flagged as spam. Worse, an article's
headlinethat doesn't match the<h1>trains AI retrieval on the wrong title.
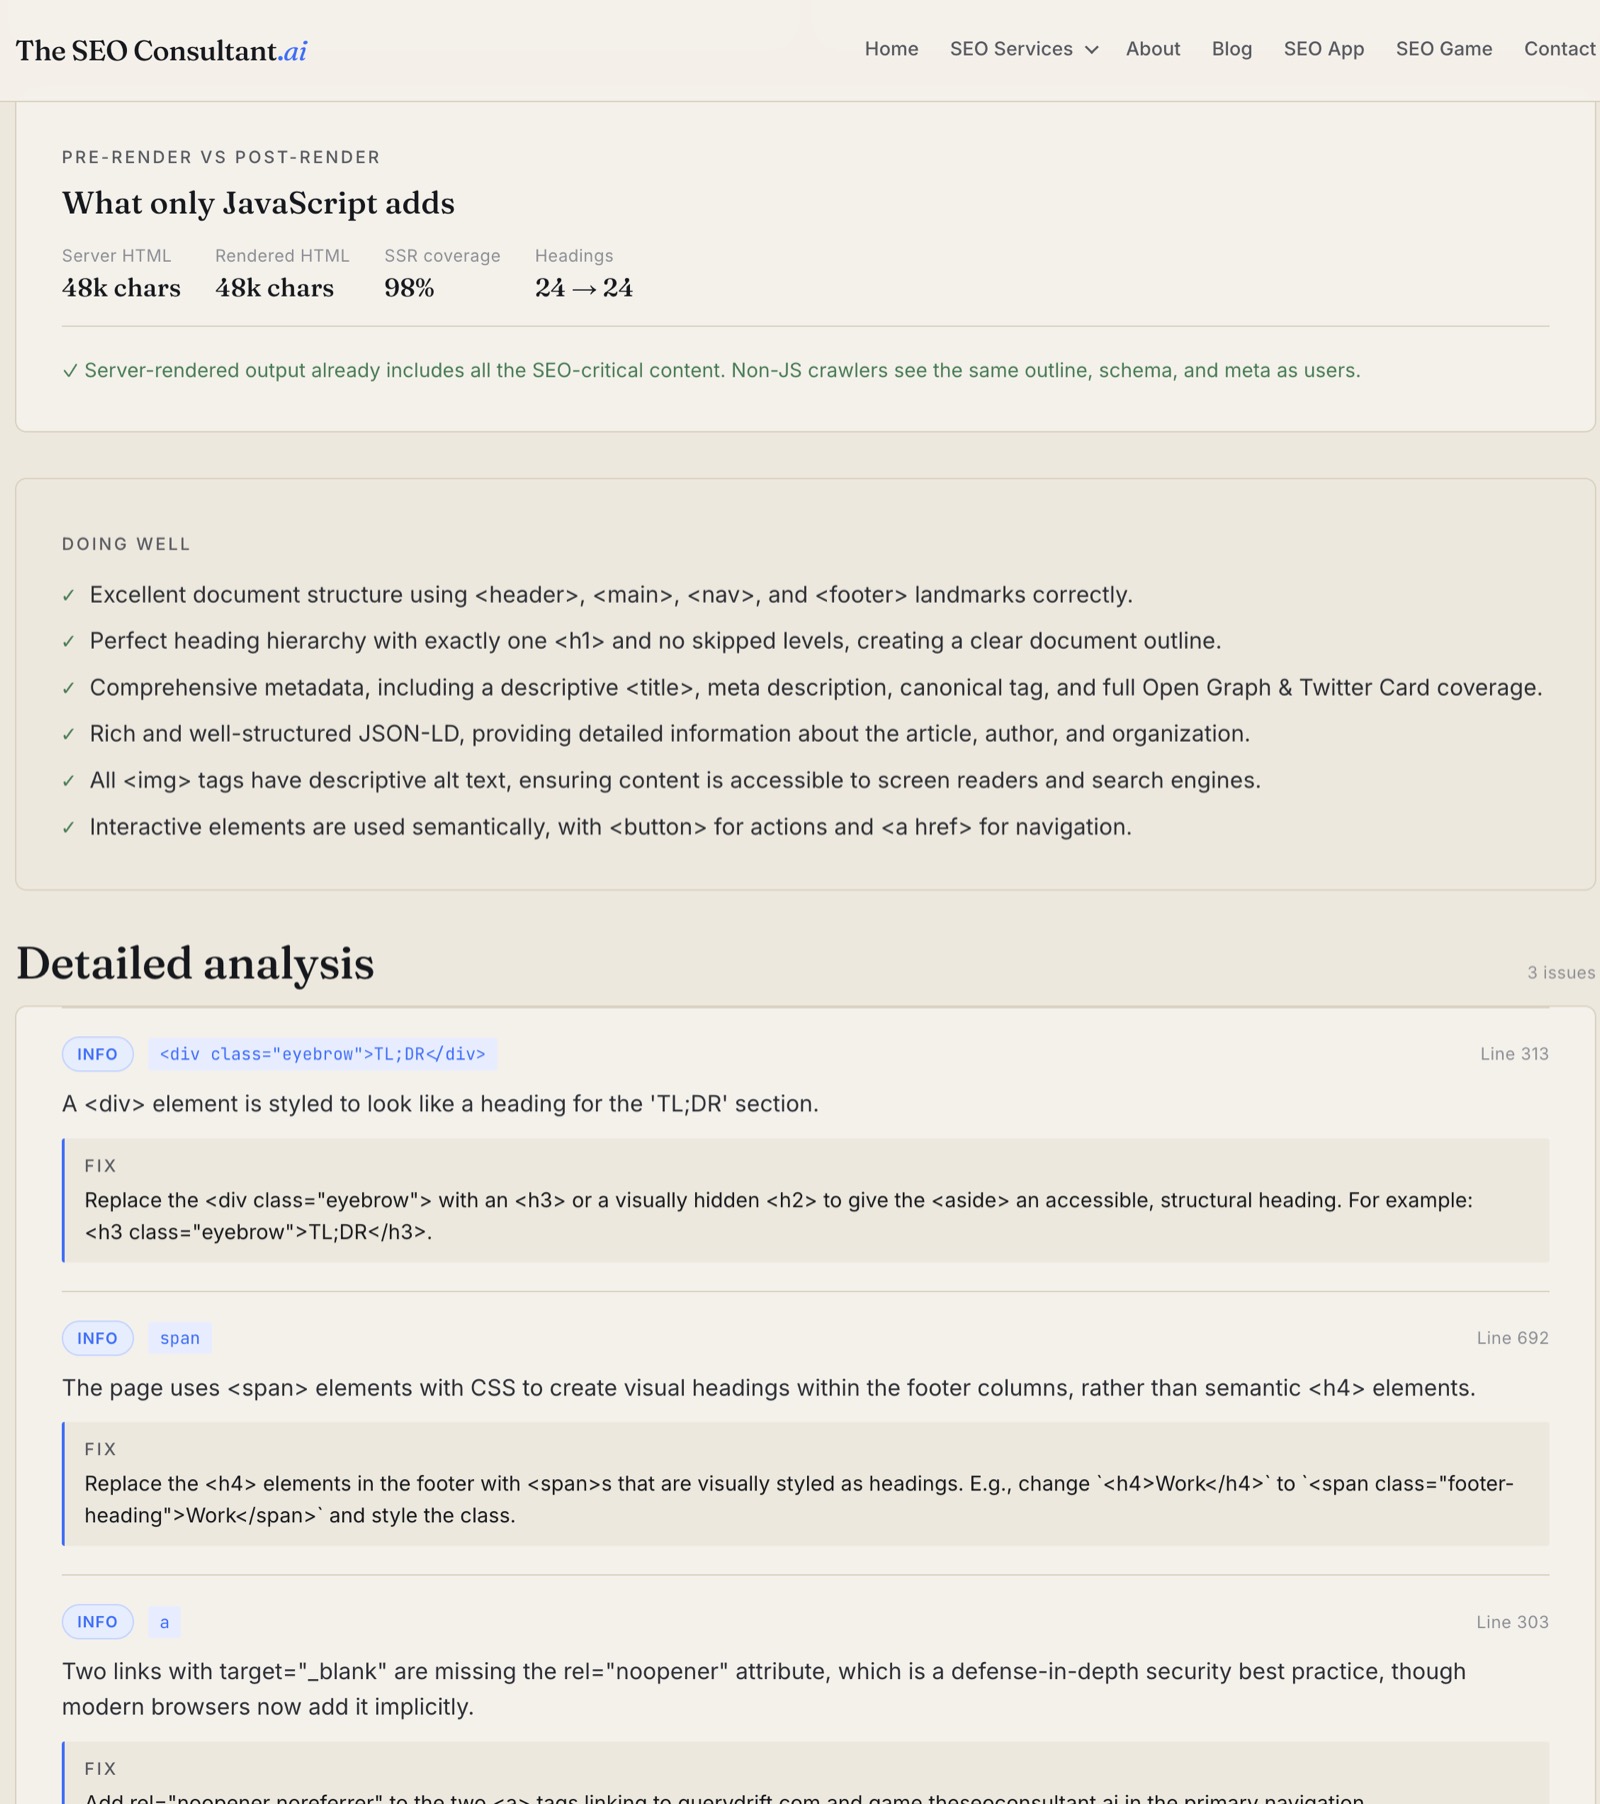
Each violation gets a severity tier — Critical (page is broken), Warning (real semantic issue), Info (defense-in-depth or polish) — and a concrete fix in the dashboard.
How It Works Under the Hood
Four stages. The first two are setup. The last two are the analysis.
1. Read the Page
Two input modes: hand it a URL, or paste rendered HTML. URL mode renders the page with JavaScript executed, so single-page apps are analyzed against the DOM users actually see — not the empty shell that ships from the server. Paste mode is for staging environments, gated pages, or pasting document.documentElement.outerHTML from DevTools.
2. Parse the DOM
A deterministic pre-pass tallies tag counts, walks the heading tree, extracts every JSON-LD @type, counts images and missing alt attributes, and computes the text-to-HTML ratio. Same input, same output — these numbers don't depend on a model.
3. Grade Against the Rule Set
The markup and tallies are then scored against the documented rule set. An LLM produces structured output: every issue is tagged with severity (Critical, Warning, Info) and a concrete fix; every strength lands in the "Doing well" list. The output schema is fixed. No free-form text. No hallucinated rules.
4. Render the Dashboard
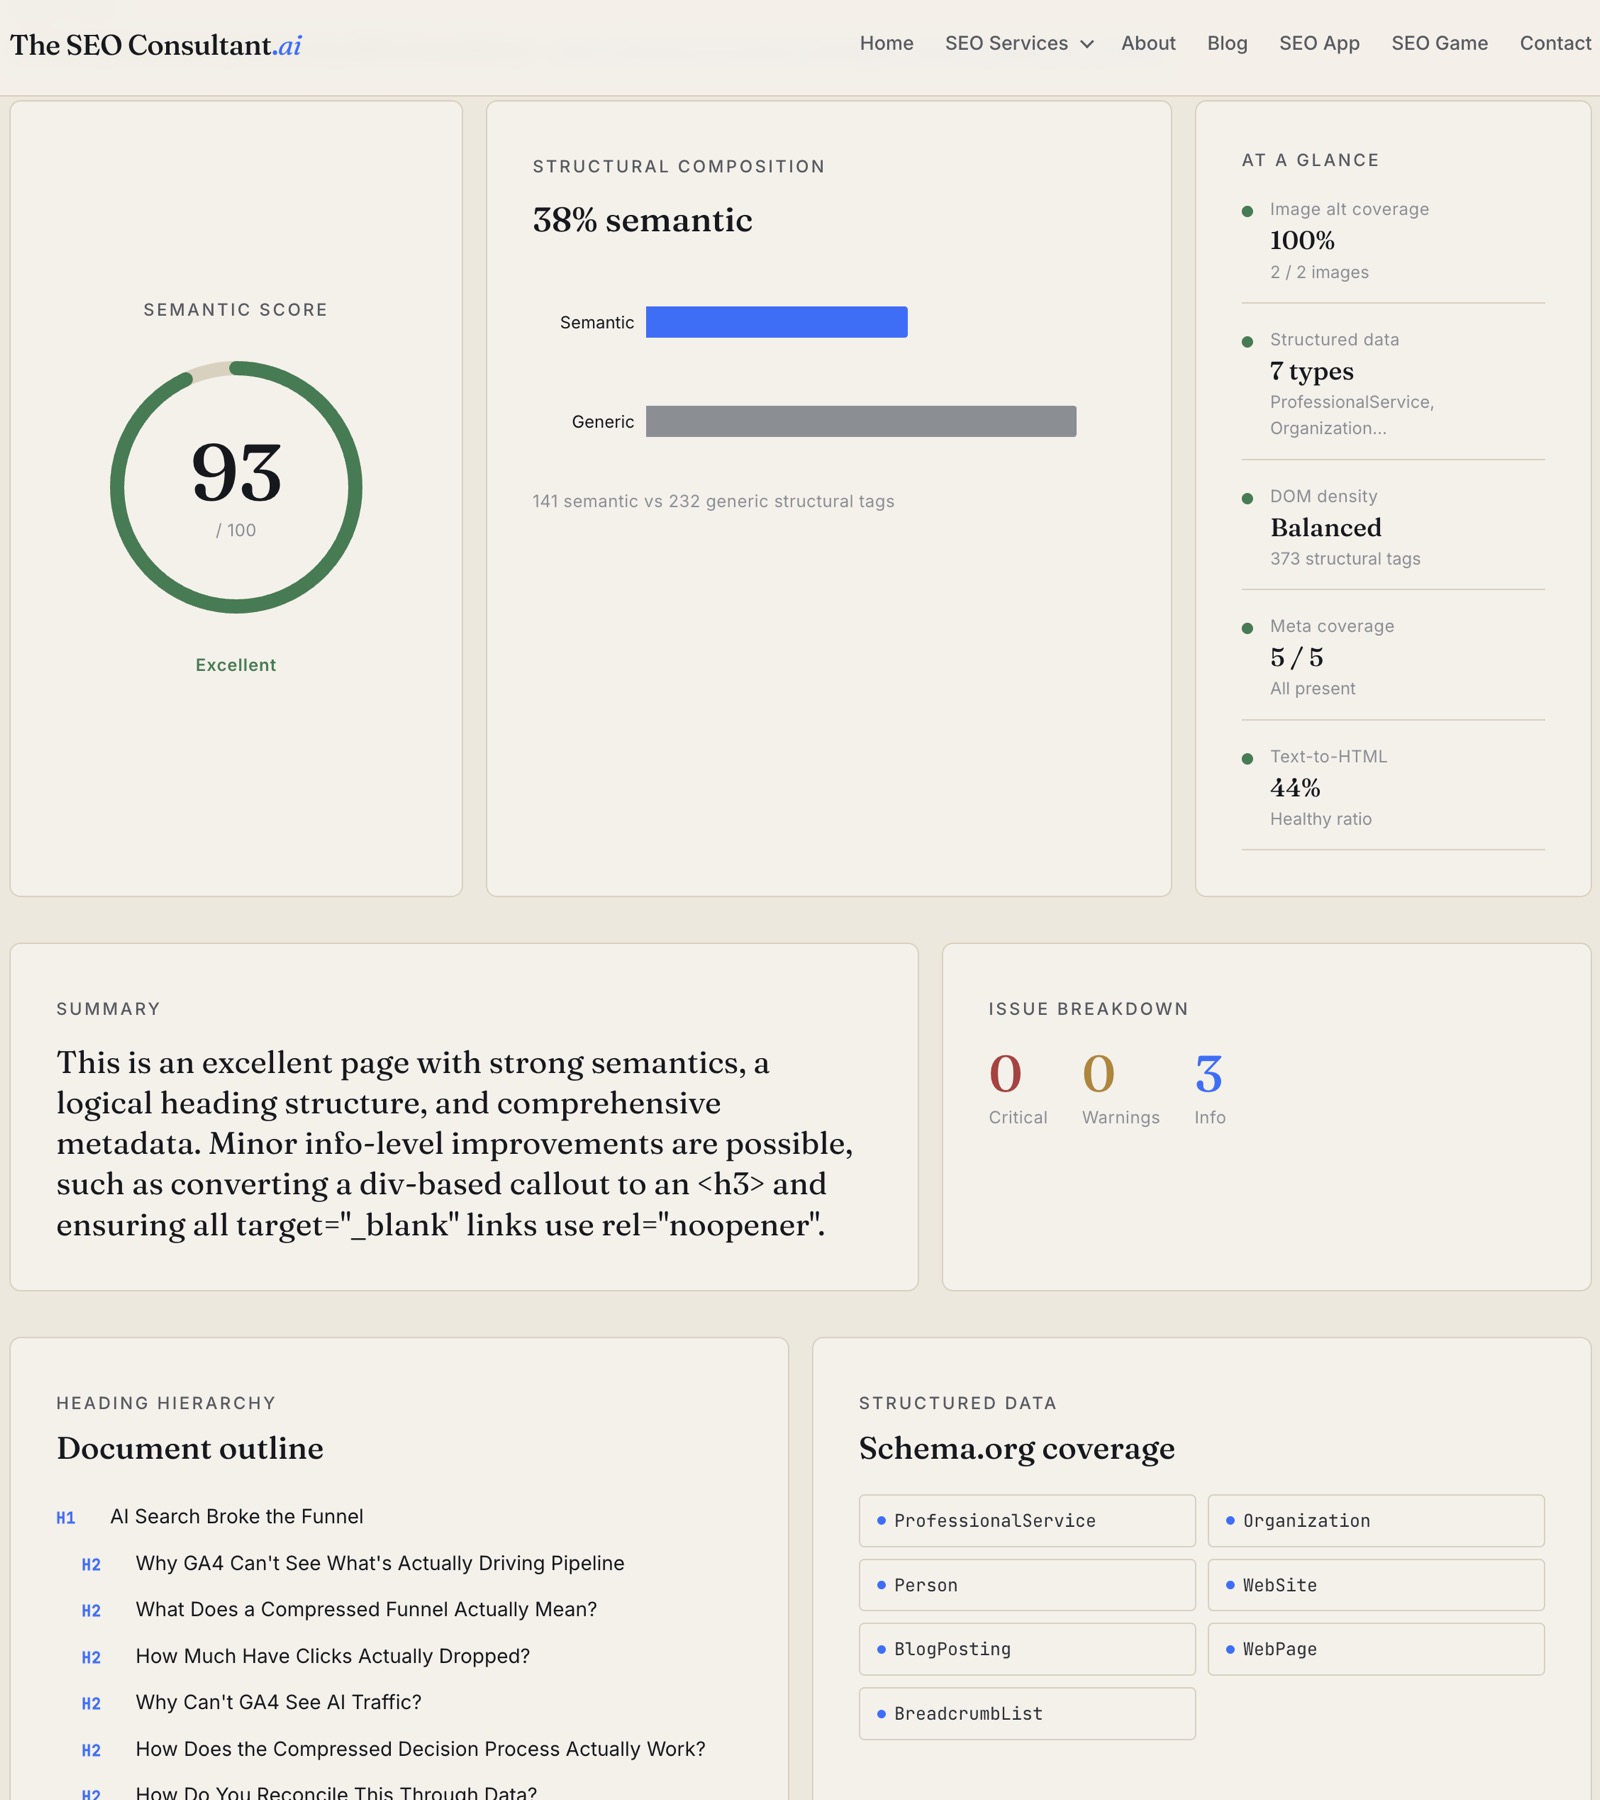
Score ring, structural composition chart, at-a-glance metrics, issue list, heading tree, Schema.org chips. The whole report is one screen on desktop. For URL analyses, a Pre-render vs Post-render comparison flags content that exists in the rendered DOM but not in the server response — important when AI scrapers walk the non-JS version of your page.
What It Reports
Semantic score (0–100)
One number, color-banded:
- ≥ 90 — Excellent. Document structure, headings, meta, and schema all hold up.
- 70–89 — borderline. A few rules off; usually worth fixing.
- < 70 — Poor semantics. The page is likely opaque to AI retrieval and assistive tech.
Structural composition
The ratio of semantic tags (<article>, <section>, <header>, <nav>, <main>, <aside>, <footer>, <figure>, etc.) to generic <div>/<span> tags. Modern React or Vue apps can ship with 5% semantic tags and 95% divs — that's the signal you want to catch.
Issue list with severity tiers
Every flagged item lands in one of three buckets, with a one-line fix suggestion:
- Critical. The page is broken in a way crawlers and assistive tech will notice. Missing
<h1>, empty<title>, no<main>. - Warning. Real semantic issues that degrade understanding but don't break parsing. Skipped heading levels, multiple H1s, missing viewport meta, missing canonical.
- Info. Defense-in-depth or polish. Missing
rel="noopener"ontarget="_blank"links, a<div>styled to look like a heading, a span standing in for an<h4>.
Heading hierarchy outline
The full H1 → H6 tree, indented by level. Skipped levels (H2 → H4 with no H3 in between) are flagged. Empty headings are flagged. Multiple H1s are flagged.
Schema.org coverage
Every @type in every JSON-LD block on the page, rendered as chips. Organization, WebSite, BreadcrumbList, Article, FAQPage — at a glance you see whether the page is feeding rich-results pipelines or coasting on default rendering.
Meta coverage
Five-checkbox summary: viewport, canonical, description, Open Graph (any og: tag present), Twitter Cards (any twitter: tag present). Missing viewport is the single most damaging fail here — Google's index is mobile-first.
Image alt and text-to-HTML ratio
Total <img> count and how many are missing alt. Plus the visible-text-to-HTML-bytes ratio — a heuristic, not a hard rule. Below 5% on a content page is suspicious; React apps routinely sit at 10–15% and rank fine.
Pre-render vs post-render
For URL analyses, the analyzer can compare what the server returns to what JavaScript renders. If your SSR shipped 12 headings but your client-side hydration adds another 18, that's a flag — non-JS crawlers (and a lot of AI scrapers) only see the first set.
What It Doesn't Do
- It's not a full Lighthouse replacement. No performance scoring, no Core Web Vitals, no accessibility tree audit beyond what semantic markup implies.
- It only sees the rendered DOM. If your CSS is hiding content with
display: none, the analyzer still counts it as present. Visual hierarchy is out of scope. - The score is directional, not absolute. Two pages with the same score can rank very differently if one has authoritative backlinks and the other doesn't. Semantic HTML is necessary, not sufficient.
- It's grading the markup, not your content. A perfectly semantic page about nothing is still a page about nothing. Use the Fan-Out Analyzer for the content side.
When to Use It
- After a redesign or framework migration. The most common time semantic HTML decays — when a designer hands a Figma to engineering and the components ship as nested divs.
- Before publishing a high-stakes page. A few minutes of fixes can be the difference between a page that's AI-Search-ready and one that isn't.
- As a quick technical-audit signal. Run a competitor's page and your own — if their score is 95 and yours is 60, that's a tangible gap to close.
- When you want a structured output to share with engineering. The issue list is concrete, line-numbered, and grounded in real best practices. No "the LLM said so."
Try It Now
Working With Me on This
The Semantic HTML Analyzer is free to use. The harder part is the rebuild — taking a Figma-driven div soup and refactoring it into something AI crawlers can actually parse without breaking the visual design. That's the kind of work the AI SEO consulting service handles. If you want me to grade your site and propose the fixes, start a conversation.