A Head-to-Head Comparison of ChatGPT, Claude, Gemini, Llama and Perplexity AI Models
One of the most common and beneficial use cases for AI tools is to help calculate numbers and visualize data so I wanted to compare the most popular LLMs to see how they compare. Time, efficiency and accuracy are all important so I’ve created a table comparing ChatGPT, Claude, Gemini, Llama and Perplexity AI models. The prompt and results are shared below after the comparison table.
| AI LLM Platform | Time to Code | Errors (Y/N) | Performance Rank |
| ChatGPT o3 Mini High | 1:45 | No | 6 |
| ChatGPT 4.0 | 1:02 | Yes | 8 |
| ChatGPT 4.5 | 0:44 | Yes | 5 |
| Claude Sonnet 3.7 | 1:36 | No | 1 |
| Gemini 2.5 Pro | 1:01 | No | 2 |
| Gemini 2.0 Flash Thinking Experimental | 0:34 | Yes | 7 |
| Llama 4 | 0:14 | No | 3 |
| Perplexity Pro Search | 0:40 | Yes | 4 |
The Test Prompt
I wanted to do a fairly simple test that required some formatting and interpretation so I asked the LLMs to visualize the historical rankings of the U.S. presidents. To ensure that the AI could parse the correct data I included a direct link to the Wikipedia data and also pasted the text into the LLMs.
“I need a Google Colab python chart showing the median rank for the US presidents. The order should be chronological based on the term number: https://en.wikipedia.org/wiki/Historical_rankings_of_presidents_of_the_United_States#Scholar_survey_summary
Term
[b][c] President Political party APSA 2024[27][32] Siena 2022[33] C-SPAN 2021[31] Siena 2018[34] APSA 2018[26] C-SPAN 2017[35] PHN 2016[24] APSA 2015[23] USPC 2011[36] Siena 2010[37][38] C-SPAN 2009[39] Times 2008[40] WSJ 2005[13] Siena 2002 WSJ 2000 C-SPAN 2000 Schl. 1996[5] R-McI 1996[41] Siena 1994 Siena 1990 Siena 1982 CT 1982 M-B 1982 Schl. 1962[4] Schl. 1948
1 George Washington Independent 3 3 2 1 2 2 3 2 3 4 2 2 1 4 1 3 2 (tie) 3 4 4 4 2 3 2 2
2 John Adams Federalist 13 16 15 14 14 19 10 15 12 17 17 13 13 12 13 16 11 14 12 14 10 15 9 10 9
3 Thomas Jefferson Democratic-Republican 5 5 7 5 5 7 5 5 4 5 7 4 4 5 4 7 4 4 5 3 2 5 4 5 5
4 James Madison Democratic-Republican 11 10 16 7 12 17 15 13 14 6 20 15 17 9 15 18 17 10 9 8 9 17 14 12 14
5 James Monroe Democratic-Republican 18 12 12 8 18 13 14 16 13 7 14 21 16 8 16 14 15 13 15 11 15 16 15 18 12
6 John Quincy Adams Democratic-Republican 20 17 17 18 23 21 17 22 20 19 19 16 25 17 20 19 18 18 17 16 17 19 16 13 11
7 Andrew Jackson Democratic 21 23 22 19 15 18 16 9 9 14 13 14 10 13 6 13 5 8 11 9 13 7 7 6 6
8 Martin Van Buren Democratic 28 29 34 25 27 34 27 25 27 23 31 40 27 24 23 30 21 21 22 21 21 18 20 17 15
9[c] William Henry Harrison Whig 41 40 40 39 42 38 – 39 – 35 39 39 – 36 – 37 – 35 28 35 26 – – – –
10 John Tyler Independent[d] 37 39 39 37 37 39 36 36 37 37 35 31 35 37 34 36 32 34 34 33 34 28 28 25 22
11 James K. Polk Democratic 25 15 18 12 20 14 22 19 16 12 12 9 9 11 10 12 9 11 14 13 12 10 12 8 (tie) 10
12 Zachary Taylor Whig 38 36 35 30 35 31 33 33 33 33 29 28 33 34 31 28 29 29 33 34 29 26 27 24 25
13 Millard Fillmore Whig 39 38 38 38 38 37 39 37 35 38 37 33 36 38 35 35 31 36 35 32 32 31 29 26 24
14 Franklin Pierce Democratic 42 41 42 40 41 41 40 40 39 40 40 41 38 39 37 (tie) 39 33 (tie) 37 37 36 35 33 31 28 27
15 James Buchanan Democratic 44 44 44 43 43 43 41 43 40 42 42 42 40 41 39 41 38 40 39 38 37 34 33 29 26
16 Abraham Lincoln Republican 1 2 1 3 1 1 2 1 2 3 1 1 2 2 2 1 1 1 2 2 3 1 1 1 1
17 Andrew Johnson National Union[e] 43 45 43 44 40 42 37 41 36 43 41 24 37 42 36 40 37 39 40 39 38 30 32 23 19
18 Ulysses S. Grant Republican 17 21 20 24 21 22 23 28 29 26 23 18 29 35 32 33 33 (tie) 38 38 37 36 32 35 30 28
19 Rutherford B. Hayes Republican 29 31 33 32 29 32 32 30 30 31 33 27 24 27 22 26 23 25 24 23 22 22 22 14 13
20[c] James A. Garfield Republican 30 27 27 28 34 29 – 31 – 27 28 34 (tie) – 33 – 29 – 30 26 30 25 – – – –
21 Chester A. Arthur Republican 33 33 30 34 31 35 35 32 32 25 32 22 26 30 26 32 26 28 27 26 24 24 23 21 (tie) 17
22/24[b] Grover Cleveland Democratic 26 26 25 23 24 23 24 23 21 20 21 19 12 20 12 17 13 16 19 17 18 13 17 11 8
23 Benjamin Harrison Republican 31 34 32 35 32 30 30 29 34 34 30 29 (tie) 30 32 27 31 19 31 30 29 31 25 26 20 21
25 William McKinley Republican 24 22 14 20 19 16 20 21 17 21 16 17 14 19 14 15 16 17 18 19 19 11 18 15 18
26 Theodore Roosevelt Republican 4 4 4 4 4 4 4 4 5 2 4 5 5 3 5 4 6 5 3 5 5 4 5 7 7
27 William Howard Taft Republican 23 25 23 22 22 24 25 20 25 24 24 29 (tie) 20 21 19 24 22 20 21 20 20 20 19 16 16
28 Woodrow Wilson Democratic 15 13 13 11 11 11 6 10 6 8 9 10 11 6 11 6 7 6 6 6 6 6 6 4 4
29 Warren G. Harding Republican 40 42 37 41 39 40 38 42 38 41 38 34 (tie) 39 40 37 (tie) 38 39 41 41 40 39 36 36 31 29
30 Calvin Coolidge Republican 34 32 24 31 28 27 31 27 28 29 26 26 23 29 25 27 30 33 36 31 30 29 30 27 23
31 Herbert Hoover Republican 36 37 36 36 36 36 29 38 26 36 34 36 31 31 29 34 33 (tie) 24 29 28 27 21 21 19 20
32 Franklin D. Roosevelt Democratic 2 1 3 2 3 3 1 3 1 1 3 3 3 1 3 2 2 (tie) 2 1 1 1 3 2 3 3
33 Harry S. Truman Democratic 6 7 6 9 6 6 8 6 7 9 5 7 7 7 7 5 8 7 7 7 7 8 8 8 (tie) –
34 Dwight D. Eisenhower Republican 8 6 5 6 7 5 9 7 10 10 8 6 8 10 9 9 10 9 8 12 11 9 11 21 (tie) –
35 John F. Kennedy Democratic 10 9 8 10 16 8 12 14 15 11 6 11 15 14 18 8 12 15 10 10 8 14 13 – –
36 Lyndon B. Johnson Democratic 9 8 11 16 10 10 11 12 11 16 11 12 18 15 17 10 14 12 13 15 14 12 10 – –
37 Richard Nixon Republican 35 28 31 29 33 28 26 34 23 30 27 37 (tie) 32 26 33 25 36 32 23 25 28 35 34 – –
38 Gerald Ford Republican 27 30 28 27 25 25 28 24 24 28 22 25 28 28 28 23 28 27 32 27 23 23 24 – –
39 Jimmy Carter Democratic 22 24 26 26 26 26 18 26 18 32 25 32 34 25 30 22 27 19 25 24 33 27 25 – –
40[f] Ronald Reagan Republican 16 18 9 13 9 9 13 11 8 18 10 8 6 16 8 11 25 26 20 22 16 – – – –
41[f] George H. W. Bush Republican 19 20 21 21 17 20 21 17 22 22 18 20 21 22 21 20 24 22 31 18 – – – – –
42[f] Bill Clinton Democratic 12 14 19 15 13 15 19 8 19 13 15 23 22 18 24 21 20 23 16 – – – – – –
43[f] George W. Bush Republican 32 35 29 33 30 33 34 35 31 39 36 37 (tie) 19 23 – – – – – – – – – – –
44[f] Barack Obama Democratic 7 11 10 17 8 12 7 18 (8)[g] 15 – – – – – – – – – – – – – – –
45/47[b] Donald Trump Republican 45 43 41 42 44 – – – – – – – – – – – – – – – – – – – –
46[f] Joe Biden Democratic 14 19 – – – – – – – – – – – – – – – – – – – – – – –
Total surveyed[b][c] 45 45 44 44 44 43 41 43 40 43 42 42 40 42 39 41 39 41 41 40 39 36 36 31 29″
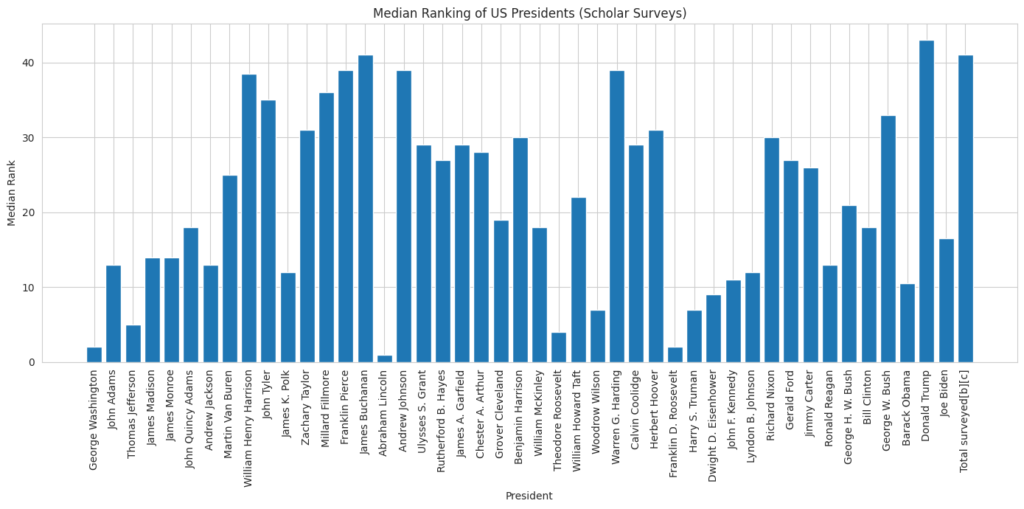
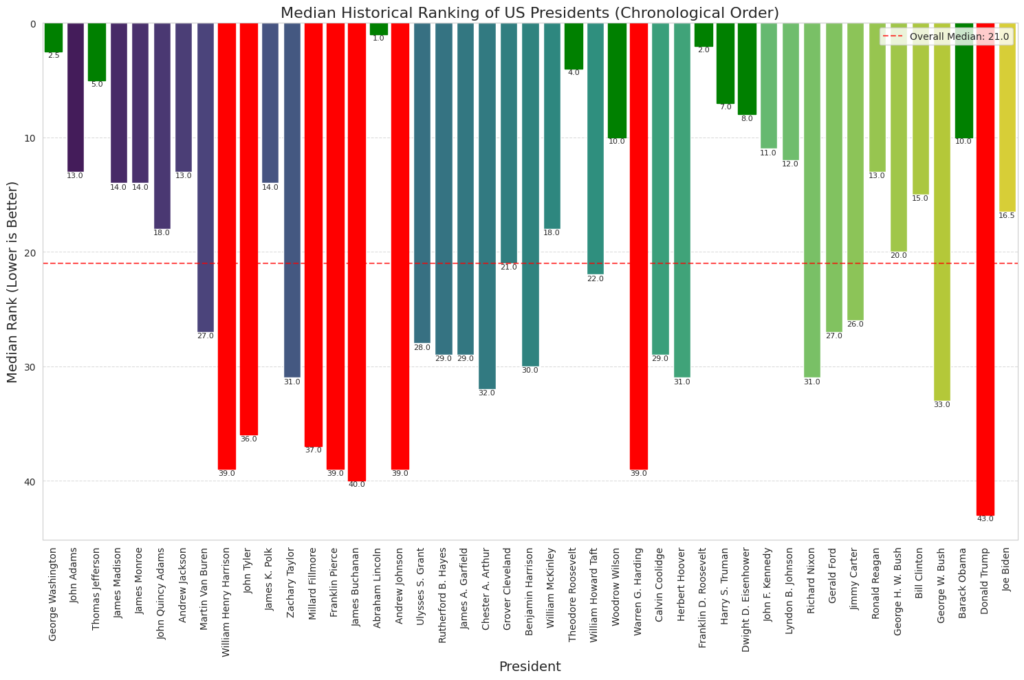
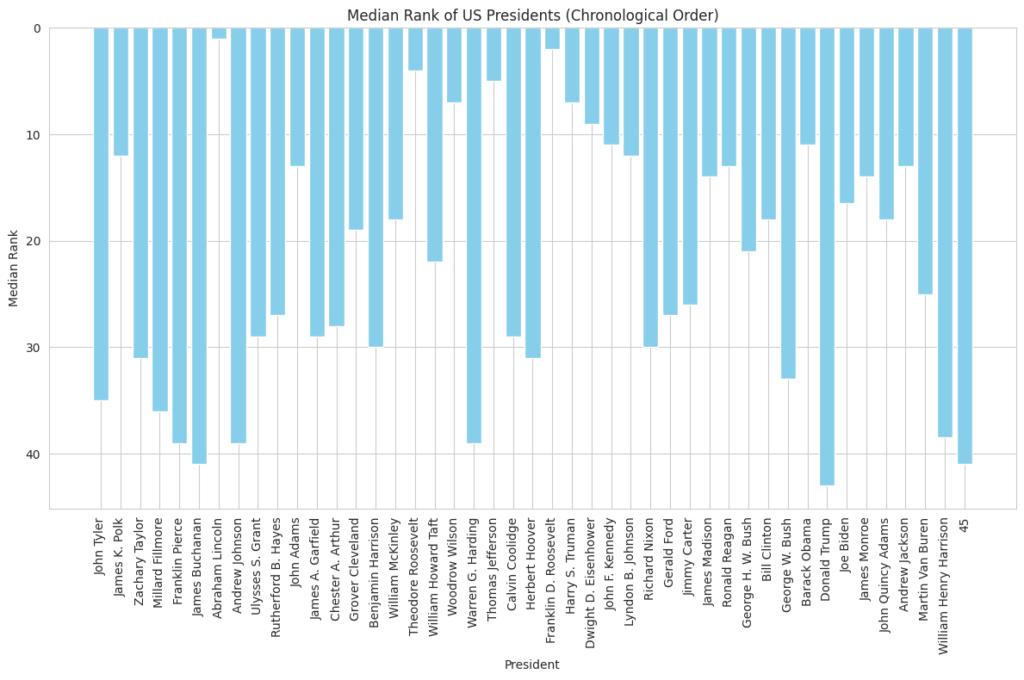
ChatGPT o3 Mini High
ChatGPT o3 Mini-High’s Python code was successful in generating a chart when linking directly to the Wikipedia table and referencing the data in my prompt. The #1 ranking should have had the largest bar but the lowest rank ended up having the largest bar.
ChatGPT 4.0
I couldn’t get the Python script to generate a chart for me in Colab after numerous debugging attempts. ChatGPT 4.0 did create a chart on it’s own after debugging itself however. The #1 ranking should have had the largest bar but the lowest rank ended up having the largest bar.
ChatGPT 4.5
ChatGPT 4.5’s Python script didn’t work initially until I had Google Colab debug the script for me. ChatGPT 4.5 did create it’s own chart after debugging itself however. The #1 ranking should have had the largest bar but the lowest rank ended up having the largest bar.
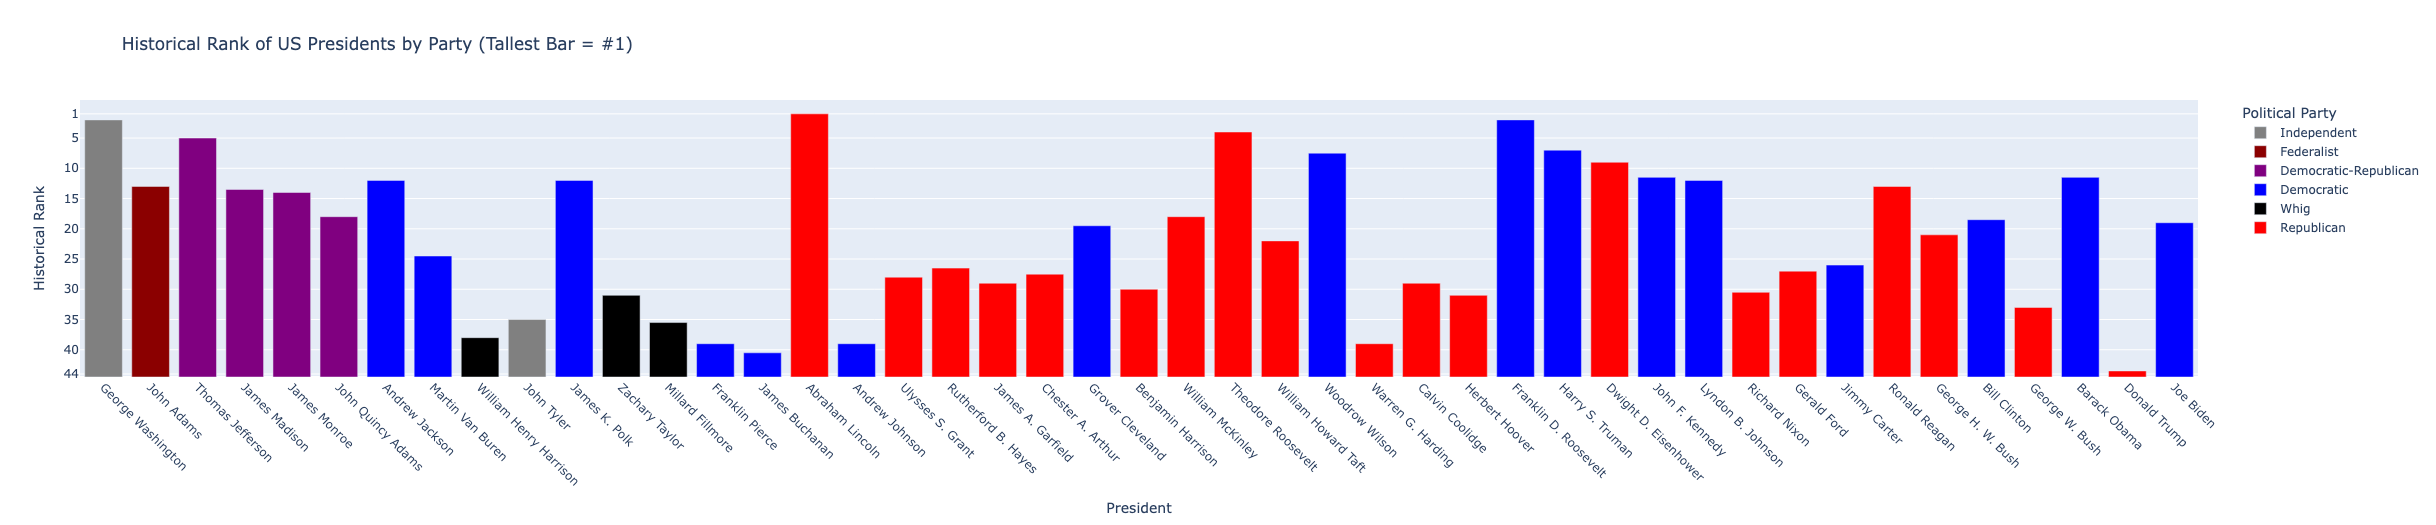
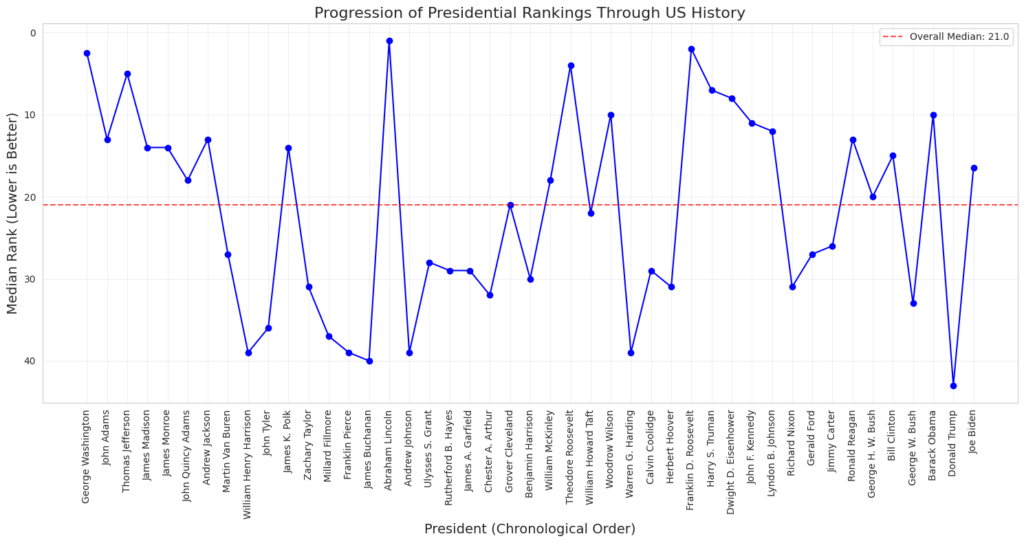
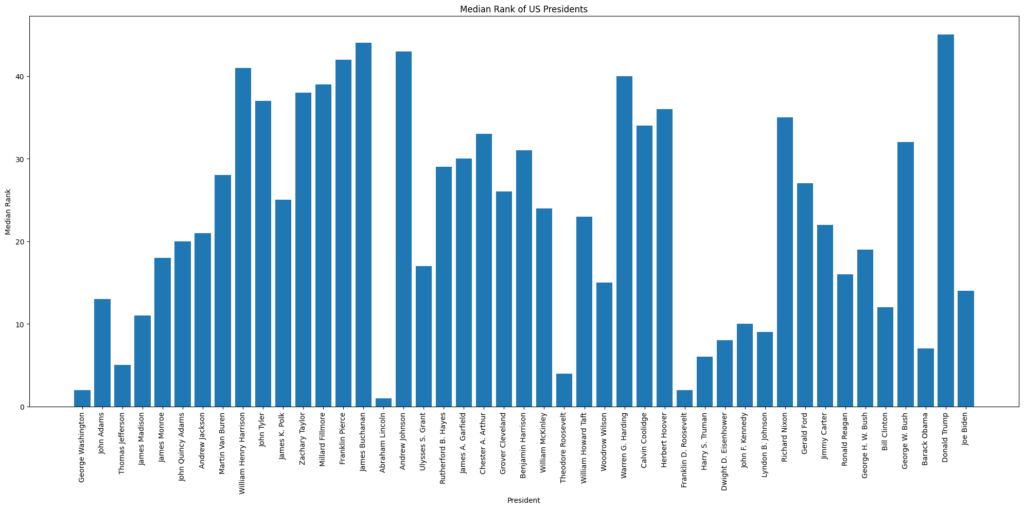
Claude Sonnet 3.7
Claude Sonnet 3.7 created two different chart visualizations for me. It was the only LLM to do this. The first of which was interesting as it colored the bars based on presidential ranking tier. The chart is upside-down however. The 2nd chart it created was the only AI model to correctly place the highest ranked presidents at the top of the chart though the chart itself is not as visually appealing as the bar charts.
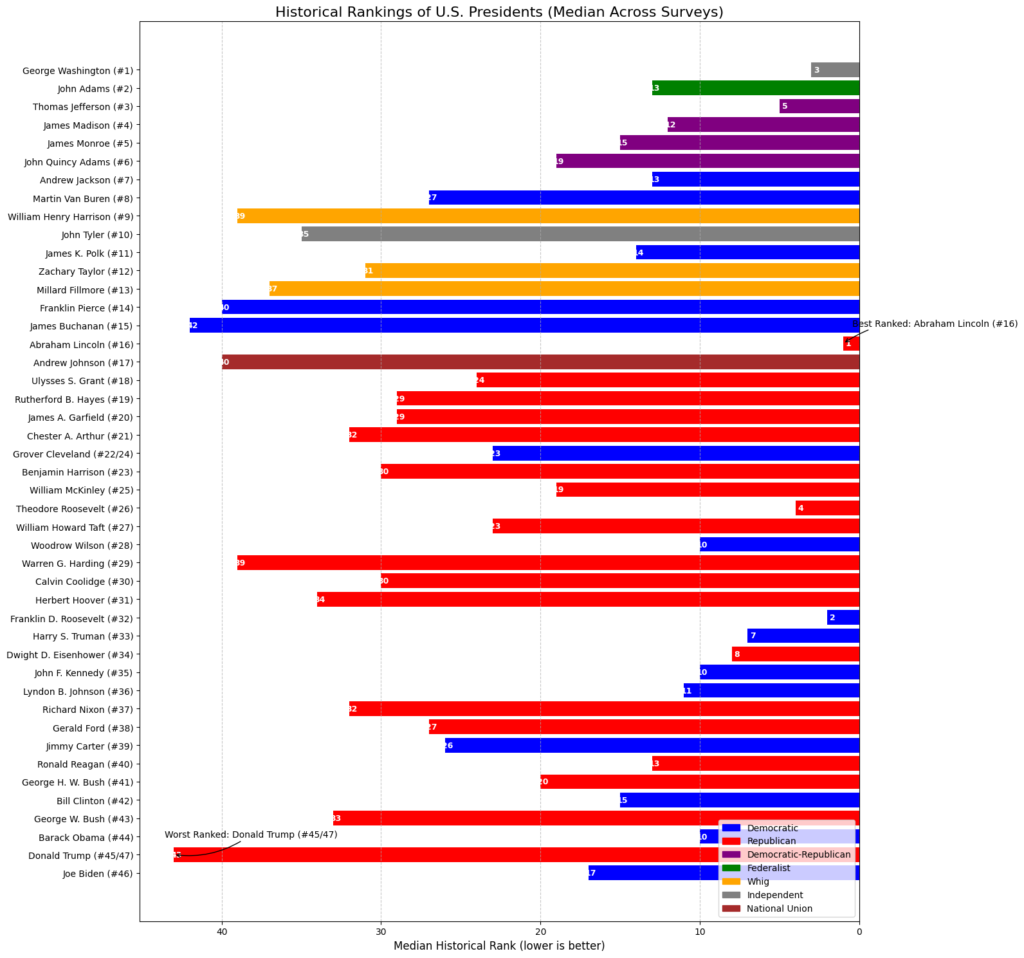
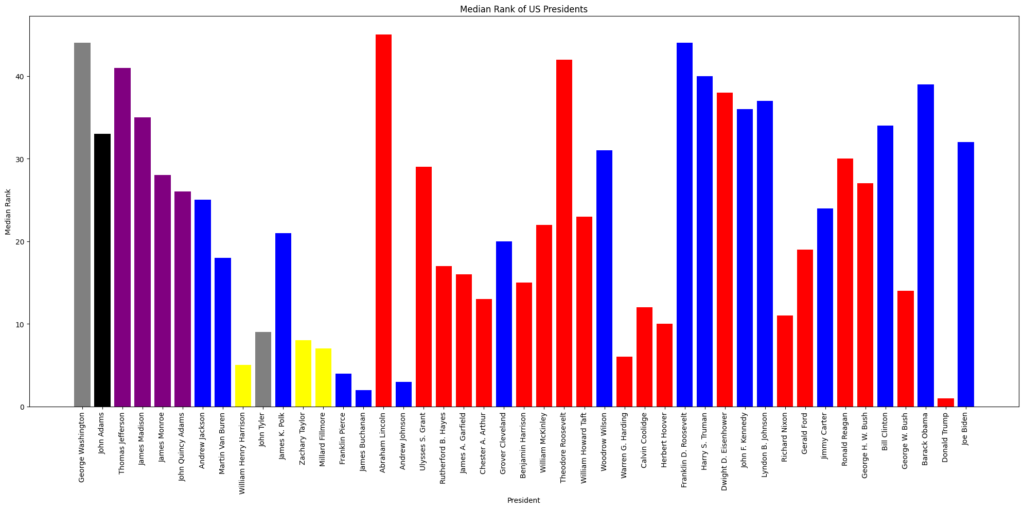
I did some other experiments outside of the test; where Sonnet 3.7 automatically color coded the presidents by political party which was helpful. The chart is a bit hard to interpret however due to the right to left orientation. I would have re-prompted Claude to fix this but I’m on the free account and ran into my character limit for the prompt window.
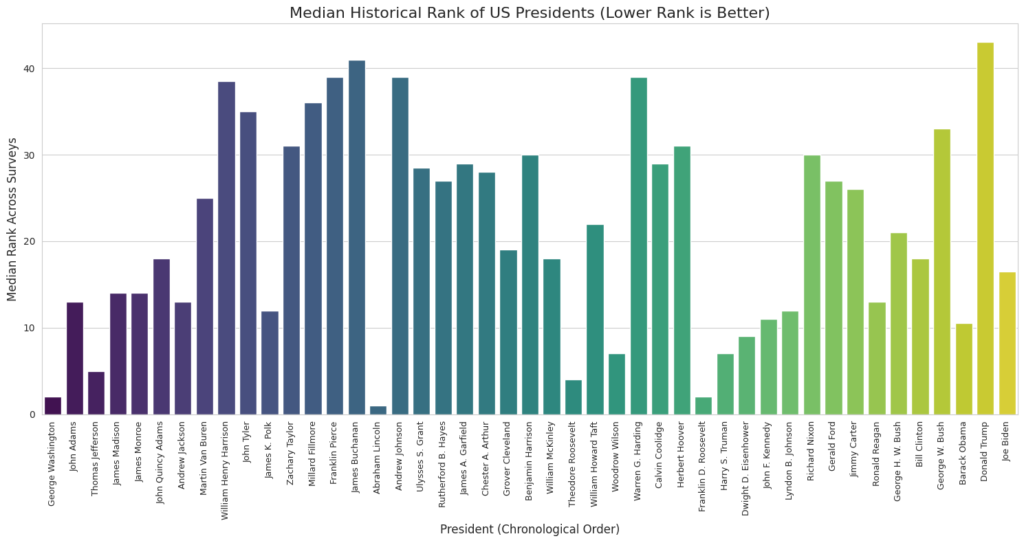
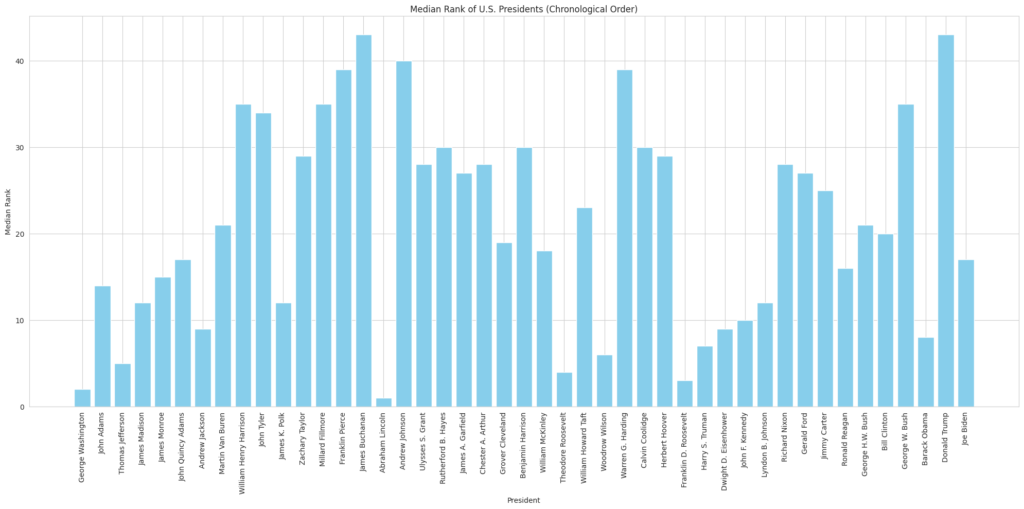
Gemini 2.5 Pro
Gemini 2.5 Pro created one of the nicest looking charts but the bar chart was inversed. The #1 ranking should have had the largest bar but the lowest rank ended up having the largest bar.
Outside of the test, I ran some additional prompts through Gemini 2.5 Pro to create the chart that I had initially envisioned.

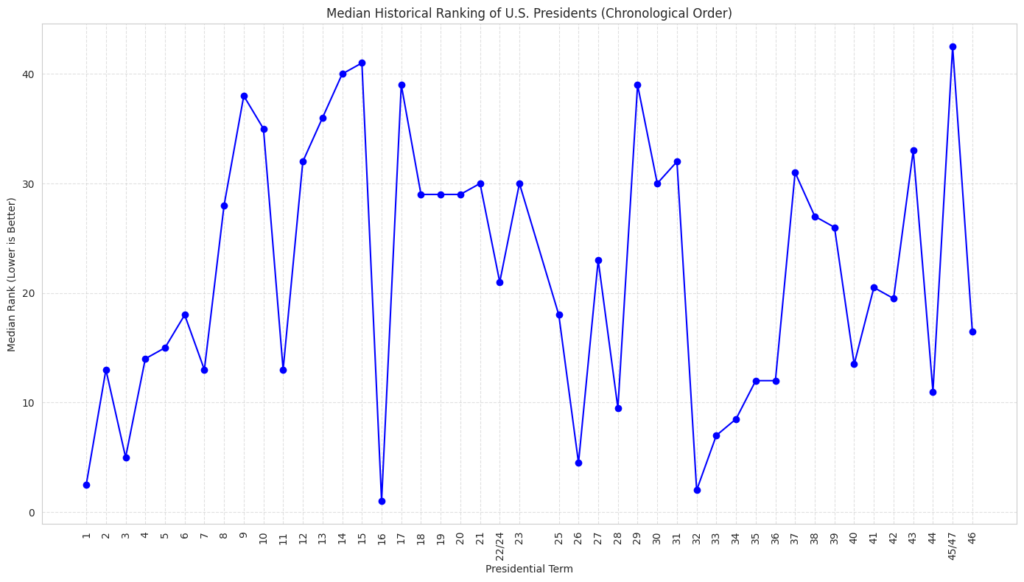
Gemini 2.0 Flash Thinking Experimental
Gemini 2.0 Flash Thinking Experimental lost half of the data and I find the chart difficult to look at as it’s essentially upside-down. It did sort of correctly place the highest ranked presidents at the top of the chart but the ways that the bars are represented is misleading. There was likely an issue with interpreting the format of the data.
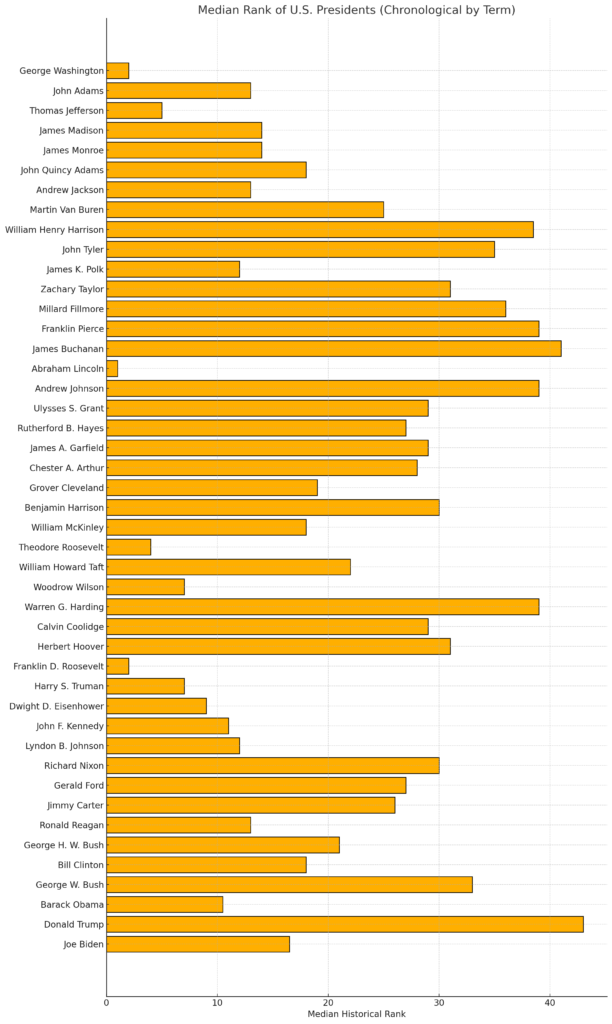
Llama 4
Meta’s Llama 4 AI was just released today so I had to include this in the test. It’s insanely fast. I’m even sure what logic they used as most of the other LLM’s show the process in how they come up with the response but Llama 4 just instantly had the numbers added up and ready to go while generating the code nearly from the moment I hit enter. The initial chart was just kind of average though.
After re-prompting Llama 4 multiple times, I was still not able to quite get the bar chart built correctly however as the y-axis labels are incorrect even though the highest ranked presidents are now represented with the largest bars. According to this chart, Abraham Lincoln is the #43 ranked US president.
Perplexity Pro Search
Perplexity Pro Search’s original Python script created a blank chart. I debugged in Google Colab and was able to generate a chart. As with most of the others, I would have preferred to see the highest ranked presidents represented with the biggest bars.
Conclusion
I was most impressed with Claude’s Sonnet 3.7 and probably could have refined the chart to where I wanted it had I chosen to go with a paid account. It was almost as if Claude was reading my mind but couldn’t quite execute it 100%. Gemini 2.5 Pro was easy to prompt and make the necessary adjustments to create the chart I had envisioned despite not starting with the best chart. I personally like using Gemini as the responses are quite detailed at explaining the rationale. Llama 4 was shockingly fast. I’m surprised the chart even worked given how fast it was at creating Python code. Llama 4 is a model I definitely want to experiment more with. I had never used any Llama models previously so this was a pleasant surprise even though I couldn’t quite get the chart that I wanted. Overall, I was disappointed with ChatGPT’s models. I’ve used o3 Mini High quite a bit for coding projects but GPT 4.0 & 4.5 failed the test.