
Conversion rate optimization should be part of your SEO & PPC toolbox.
SEO and paid search are obviously capable of driving a significant amount of traffic to a site, and for many sites it’s their primary method of web traffic generation. Driving web traffic is only half of the equation there however. What does user do once they land on the page? Analytics tools like Google Analytics 4 (GA4) can tell you the number of lead gen form completions, purchases or the amount of times a video was clicked from your performance marketing channels but those are just numbers.
Heatmaps
The only way to really know what users are doing when they get to your site is to heatmap your website. My preferred tool of choice when working for companies is CrazyEgg. There are all sorts of insights you can gain from utilizing a heat mapping / CRO tool like CrazyEgg. Being able to see what users in aggregate are clicking on (or not clicking on) is invaluable for optimizing your web experience. Sometimes you might find out that people are constantly clicking on an image that doesn’t link to anything. Or you may find that most users are clicking on something that you would prefer that they not click on. If that’s the case, then you can decide to remove that element or de-emphasize it to improve your performance. With CrazyEgg, you can also set up your conversion goals and filter the results to show what converting users are doing on the site.
Scroll Maps
While heat maps are designed to show what people click on. People won’t be clicking on something that they never saw in the first place. That’s where scroll maps come into play. You might have great content but if it’s not laid out in an optimal way for your users then it can lead to inefficient scrolling and missed opportunities.
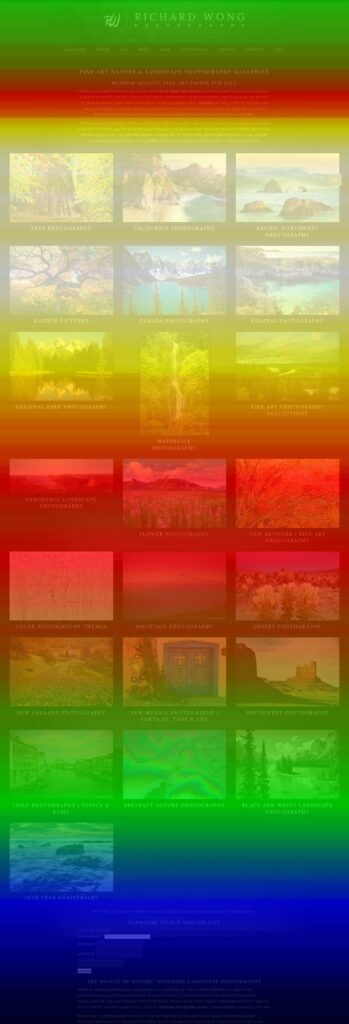
Below is an example from my own personal website. If I want to sell more artwork from certain galleries then those gallery tiles should be in the white scroll zone here. It’s not a coincidence that I’ve put my top-selling galleries at the top here. Now imagine if I wanted to make my site all fancy and throw a huge hero image at the top and loads of SEO web copy above the gallery grid. All of the sudden my gallery click scrolling would be in the red or green zones which is not what I want to happen. This is a point that I make to all of the companies that I work for. People naturally want eye-catching design, but that’s not always conducive to your business goals so you have to analyze heat maps and click maps like this to know what your users want to see.

Conversion Rate Optimization
I’ve covered some methods that I use to analyze website behavior. The end goal here is to use those insights to improve my conversion performance with CRO. When I was working for Backroads, the quickest big impact win I’ve had in performance marketing actually had nothing to do with channel management (SEO, SEM, Social, Email, etc…).
It was through heat mapping my company’s website. By reviewing heat maps + click maps on the most popular pages on our core web templates, two things were clear.
- While the content was important for the user journey, users were largely not scrolling through that much of the page.
- CTA buttons were clicked a lot, when they were present.
So what did I do? I requested to add anchor links at the top of the page for each section so the user could decide what was most relevant for them. Then I also requested to add CTA buttons for each section rather than just at the top of the page which users would quickly scroll past.
CRO Results From Heat Map Insights
The scroll maps suddenly started lighting up through most of the page. We saw an +40% increase in conversion rates and leads overnight. Mobile lead generation in particular caught up with desktop performance. Business was booming all the way through the rest of my time at the company.